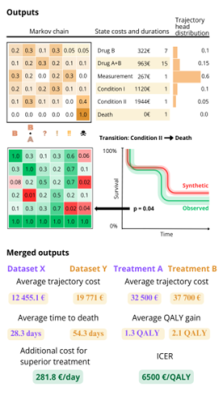
R-package TrajectoryMarkovAnalysis specializes in modeling patient trajectories using Markov chains. The package supports discrete and continuous time Markov models, Kaplan-Meier plots, Markov trees and synthetic data generation. The package is based on OMOP CDM.
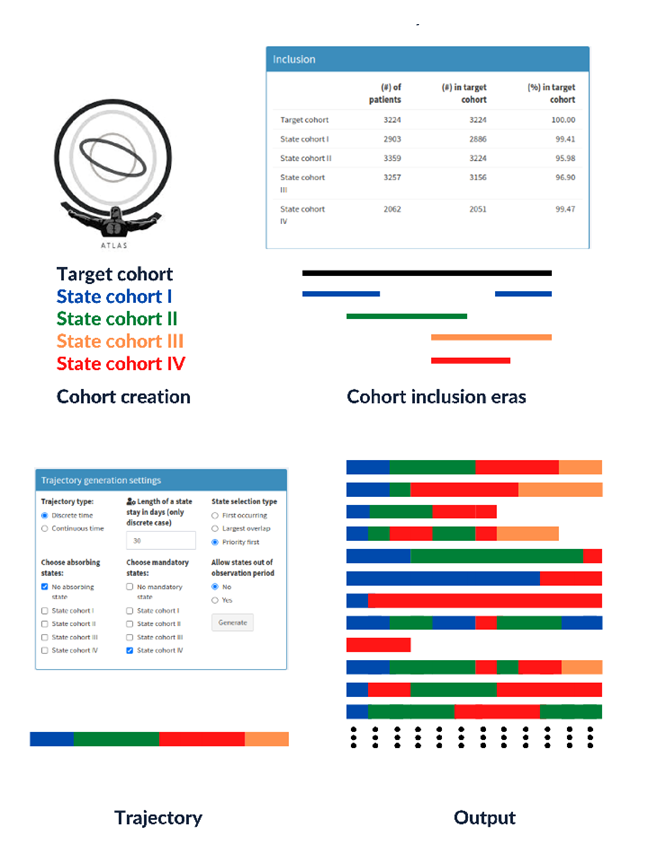
Package Cohort2Trajectory creates patient orientated treatment trajectories from cohorts defined in OHDSI ATLAS. The package can be used with access to OMOP CDM database. The package creates discrete and continuous time trajectories (and outputs them as .csv file) which describe patients’ treatment through time. Package can be run with GUI or CLI.
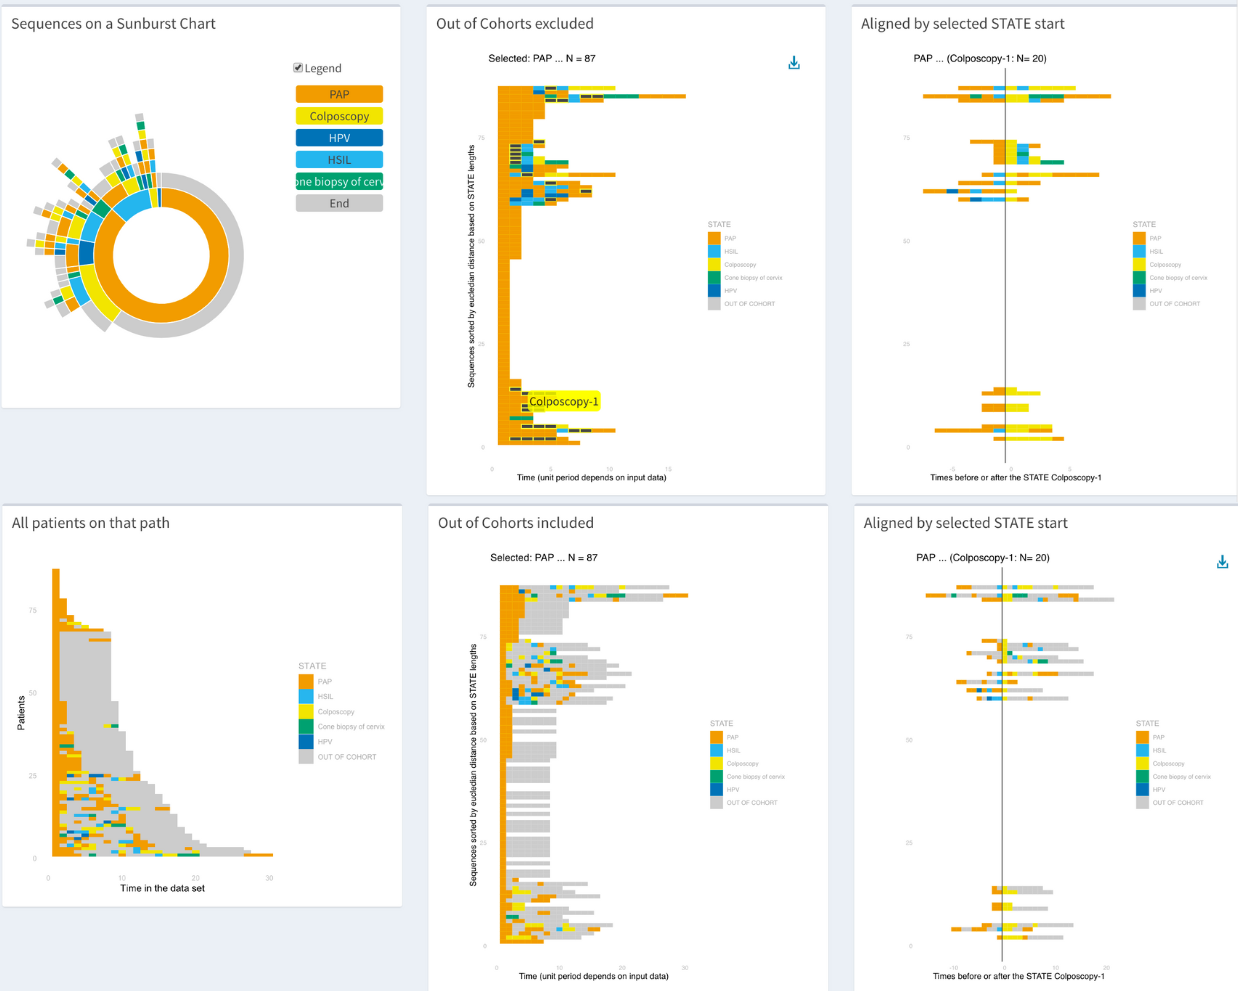
TrajectoryViz is an R package for visualizing patient level event sequences, to complement the sunburst plot based analyses. The patient level sequences can be filtered, shown with the gaps or without, and aligned by different events. All these visualisations are interactive allowing both quantifying the interesting aspects or zooming into interesting patterns. To make the visualization compatible with any OMOP formatted database TrajectoryViz relies on Cohort2Trajectory package in R.
CohortContrast makes cohort comparisons easy across OMOP CDM datasets. With its GUI, you can explore differences, visualize contrasts, and build concept sets through mapping. Plus, it connects seamlessly with Cohort2Trajectory and TrajectoryViz.
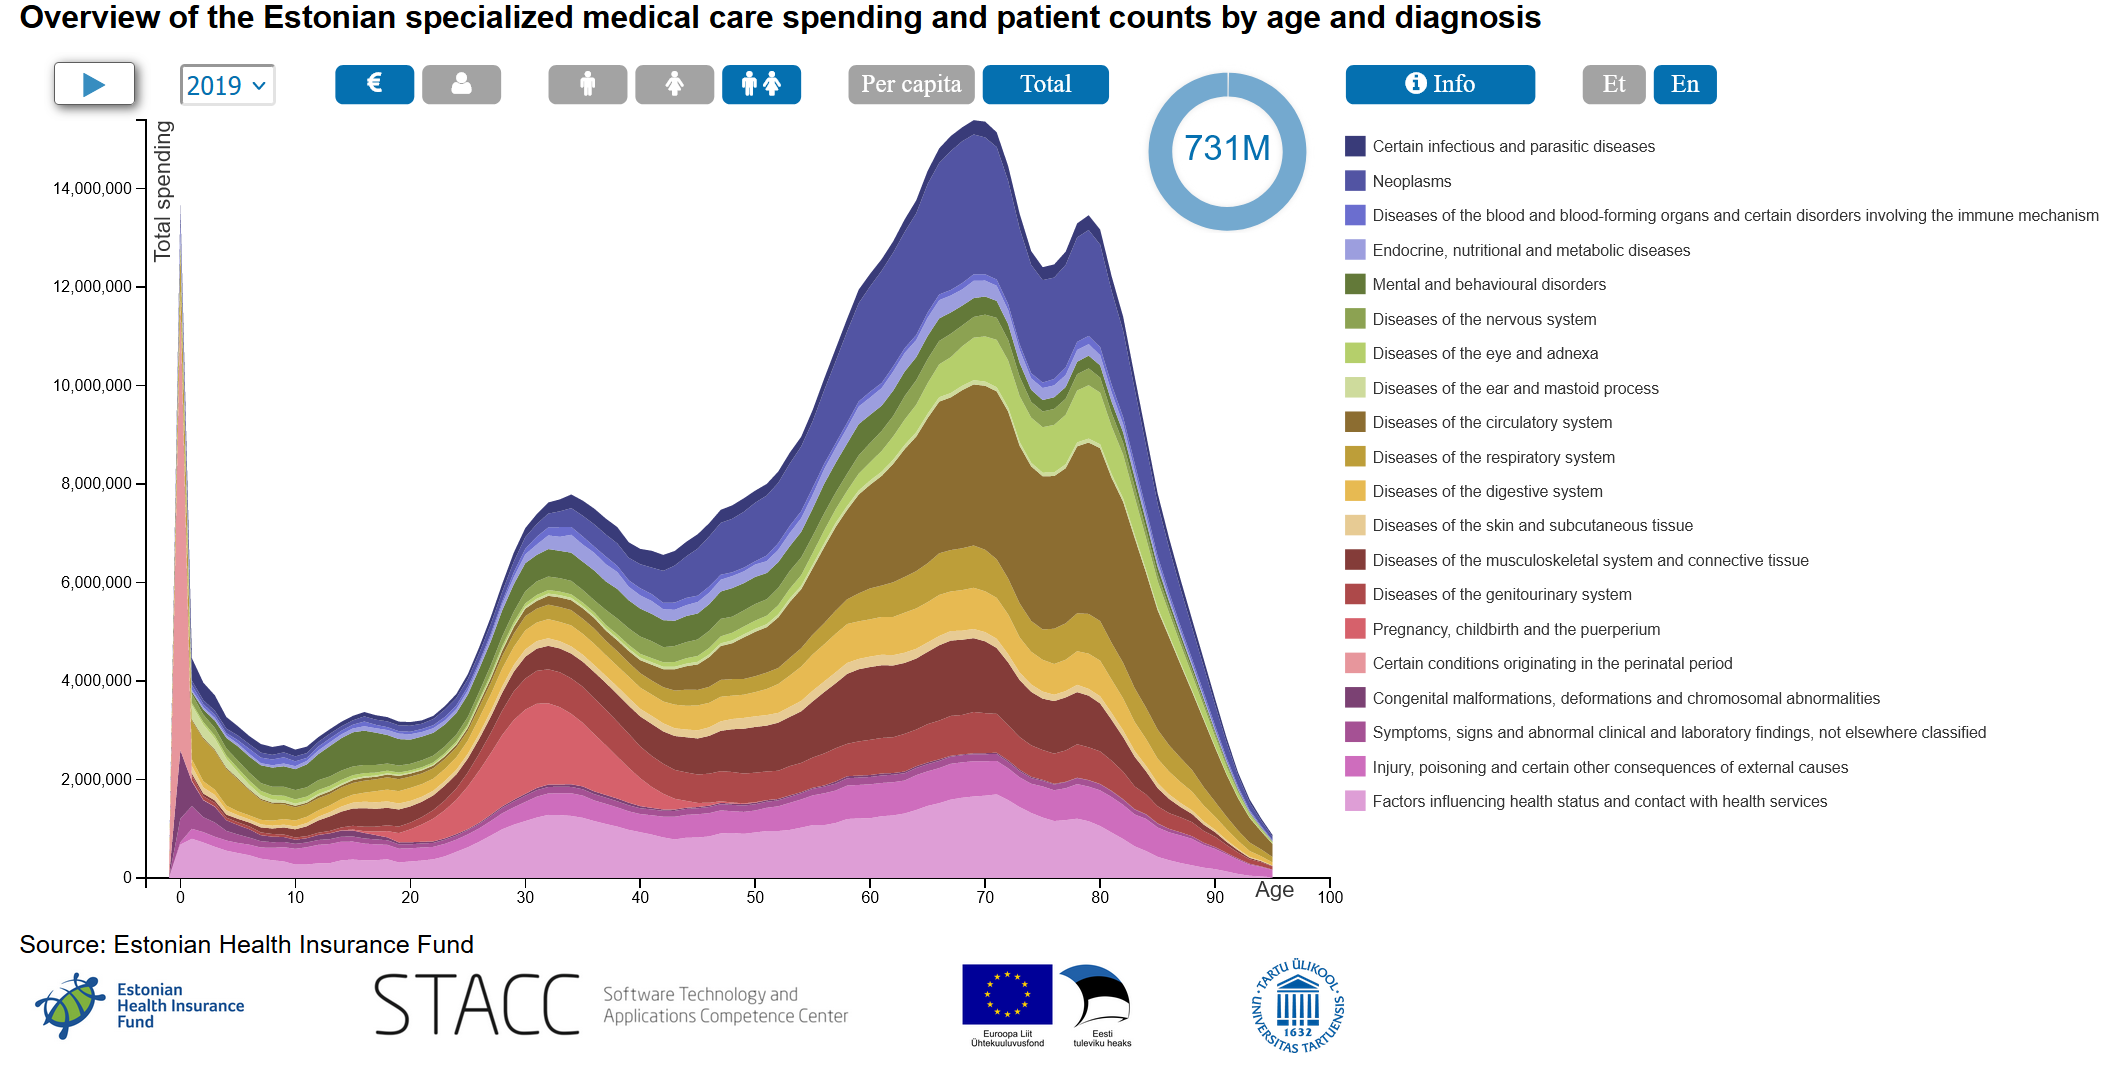
The interactive chart is based on 6.5 million claims from specialist medical care in 2013-2019. The data is grouped by age, gender and main diagnosis. The chart is created in co-operation with Estonian Health Insurance Fund.
Translations of various health-related code sets used in the Estonian healthcare system to OMOP CDM (Common Data Model) standard concepts is gathered into one respository. The translations aim to facilitate the integration and standardization of health data for research and analytics.
The respository contains mappings for diseases, drugs, healthcare services, NCSP, lab measurements, demographics, health behaviour, death attributes, healthcare providers.